
June 1st, 2015


前言:
架設好主機後,接下來開始就是要優化效能.其實有很多人建議了不少的優化與調整工具,不過這裡還是使用兩個視覺化可以很快調整的工具.
- gcvis: 由Dave Cheney所開發的工具,可以很清楚的觀察GC(Garbage Collection)發生的時間點與Heap的大小,讓你可以了解系統由於GC消耗的多少的系統資源.
- pprof:這個系統build-in的工具,可以讓你產生每個function所產生的方塊圖可以讓你清楚找出系統裡面的bottleneck.
這裏只是簡單的使用流程與心得,不過應該會有更多的資料補充.
關於gcvis
安裝與使用
- go get github.com/davecheney/gcvis
- 使用相當簡單
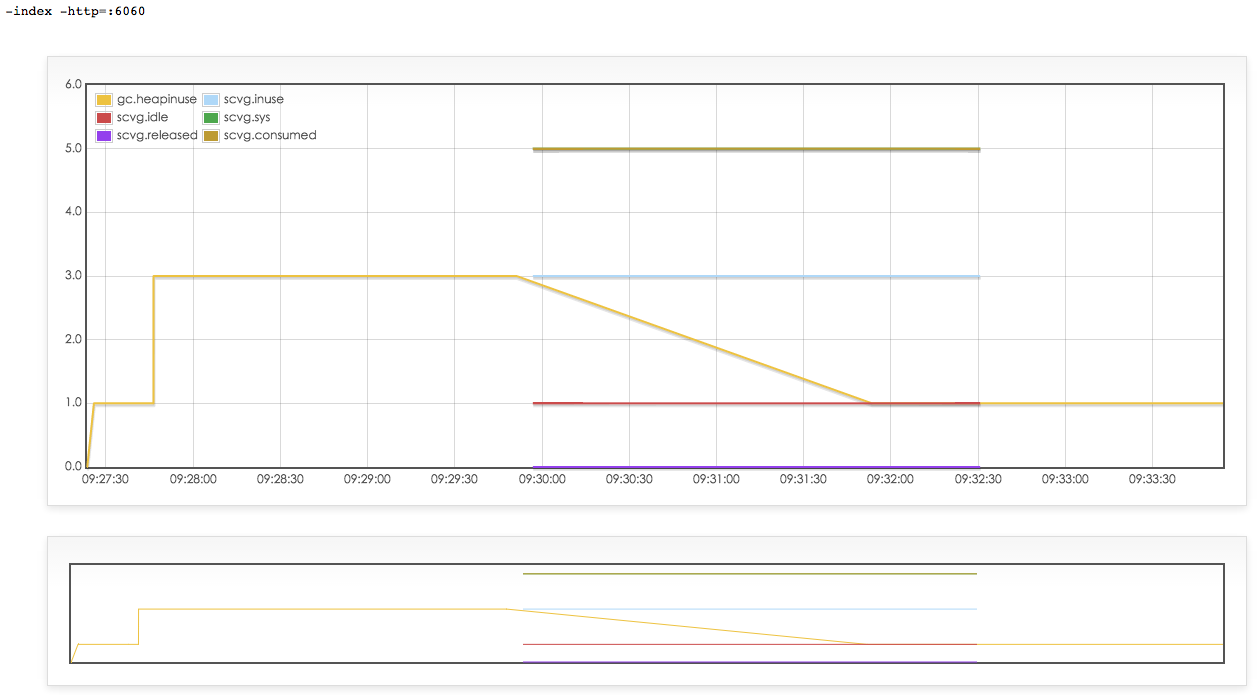
gcvis YOUR_APP -index -http=:6060
就會打開一個網頁顯示目前的heap與GC狀態
關於pprof
必須要先安裝好Graphviz
- 執行
go tool pprof http://localhost:YOUR_WEB_PORT/debug/pprof/profile - (pprof) top10
- (pprof) web
會出現一個圖類似以下:

###問題: Go-martini會將handler預設是沒有開放的,所以會得到404 page not found:
 import "net/http/pprof"

 //Some martini init here.
 m.Group("/debug/pprof", func(r martini.Router) {
        r.Any("/", pprof.Index)
        r.Any("/cmdline", pprof.Cmdline)
        r.Any("/profile", pprof.Profile)
        r.Any("/symbol", pprof.Symbol)
        r.Any("/block", pprof.Handler("block").ServeHTTP)
        r.Any("/heap", pprof.Handler("heap").ServeHTTP)
        r.Any("/goroutine", pprof.Handler("goroutine").ServeHTTP)
        r.Any("/threadcreate", pprof.Handler("threadcreate").ServeHTTP)
    })
心得:
- 使用
gcvis可以幫助你瞭解目前Heap的數量,記憶體使用數量與GC發生的次數.記住,越多的GC代表著系統資源消耗在回收與釋放記憶體. pprof可以完成一個樹狀圖.不過,目前在Web Application這裏可能還需要有更多的技巧找出真正卡住系統資源的地方.- Go 1.5 有出新的tracer, 等 1.5出來可以試著用用看….
相關文件:
- pprof:
- Go的pprof使用
- Debugging performance issues in Go programs
- Intel出的研究文章,相當詳細的解釋.
- bee
- Godoc:pprof
- gcvis: